
See the thinking behind the work.
Explore original demonstration materials, practical references and technical examples. A closer look at the way ideas become solutions.
sales_analysis.py
import pandas as pd
import matplotlib.pyplot as plt
# Turn data into understanding
sales = pd.read_csv('sales.csv')
summary = sales.groupby('region')
.revenue.sum()
summary.plot(kind='bar')
Information Technology
Python Data Analysis
Code & data analysis
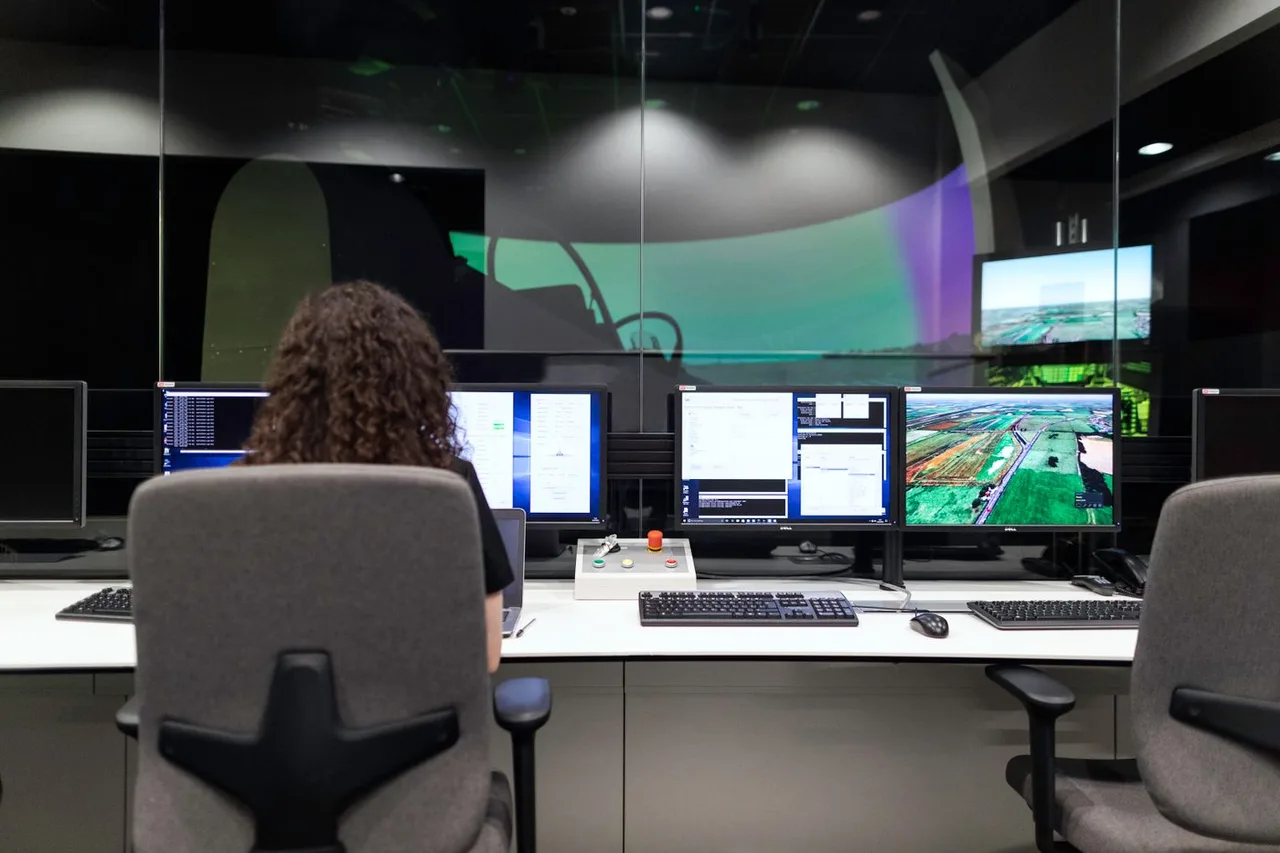 DEMONSTRATION
Mechanical Engineering
CAD Assembly Design
Engineering reference
 DEMONSTRATION
Civil Engineering
Building Structural Model
Structural concept study
Financial overview FY 2025 · DEMO
REVENUE£128,000Synthetic dataset
GROSS MARGIN37.8%Illustrative reporting
Monthly performanceJAN FEB MAR APR MAY JUN JUL AUG SEP OCT NOV DEC
Finance & Accounting
Financial Performance Dashboard
Dashboard & reporting
 OWNER-SUPPLIED REFERENCE
Finance & Accounting
Financial Accounting Report
Owner-supplied report
 OWNER-SUPPLIED REFERENCE
Information Technology
Python Sales Analysis Report
Owner-supplied report
 OWNER-SUPPLIED REFERENCE
Civil Engineering
Cultural and Architectural Design Study
Owner-supplied design report
 OWNER-SUPPLIED REFERENCE
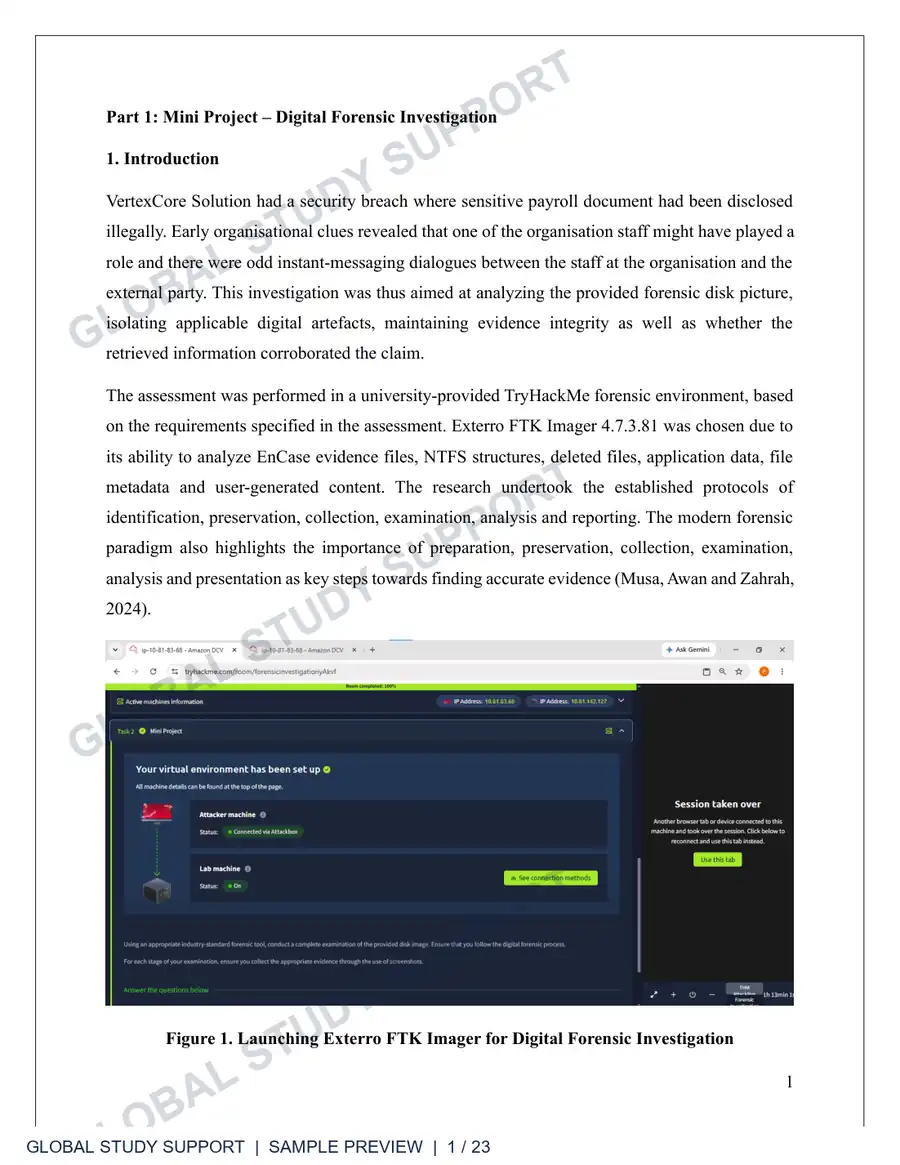
Information Technology
Digital Forensics Investigation Report
Owner-supplied educational report
 OWNER-SUPPLIED REFERENCE
Civil Engineering
Revit BIM Coordination Report
Owner-supplied BIM report
 OWNER-SUPPLIED REFERENCE
Management
Talent Acquisition and Retention Report
Owner-supplied research report
 OWNER-SUPPLIED REFERENCE
Management
SME Innovation and Internationalisation Report
Owner-supplied research report
YOUR NEXT STEP STARTS HEREA challenge in mind?
Tell us what you need A challenge in mind?
Let’s work through it.
Share your goals. We’ll help you find a clear way forward.