
Python Data Analysis
An exploratory analysis of a small, synthetic sales dataset. Follow a reproducible workflow from data validation to regional comparisons and a clearly documented conclusion.
import pandas as pd
import matplotlib.pyplot as plt
# Turn data into understanding
sales = pd.read_csv('sales.csv')
summary = sales.groupby('region')
.revenue.sum()
summary.plot(kind='bar')
Project overview
An exploratory analysis of a small, synthetic sales dataset. Follow a reproducible workflow from data validation to regional comparisons and a clearly documented conclusion.
Original demonstration using synthetic information or conceptual assumptions. This is not verified client work. Engineering material is not approved for manufacturing or construction.
Objectives
- Validate a small synthetic sales dataset.
- Compare regional revenue without overstating the result.
Tools and concepts
Methodology
- Read the CSV and check required fields, missing values and numeric revenue.
- Aggregate revenue by region and export a sorted summary.
- Plot regional totals and document the limits of six synthetic observations.
Preview context
The photograph or code-based preview above is illustrative. The PDF pages below contain the reference material.
Learning outcomes
- Recognise data-quality checks before analysis.
- Explain a group-by aggregation and its limitations.
PDF preview
Loading page...
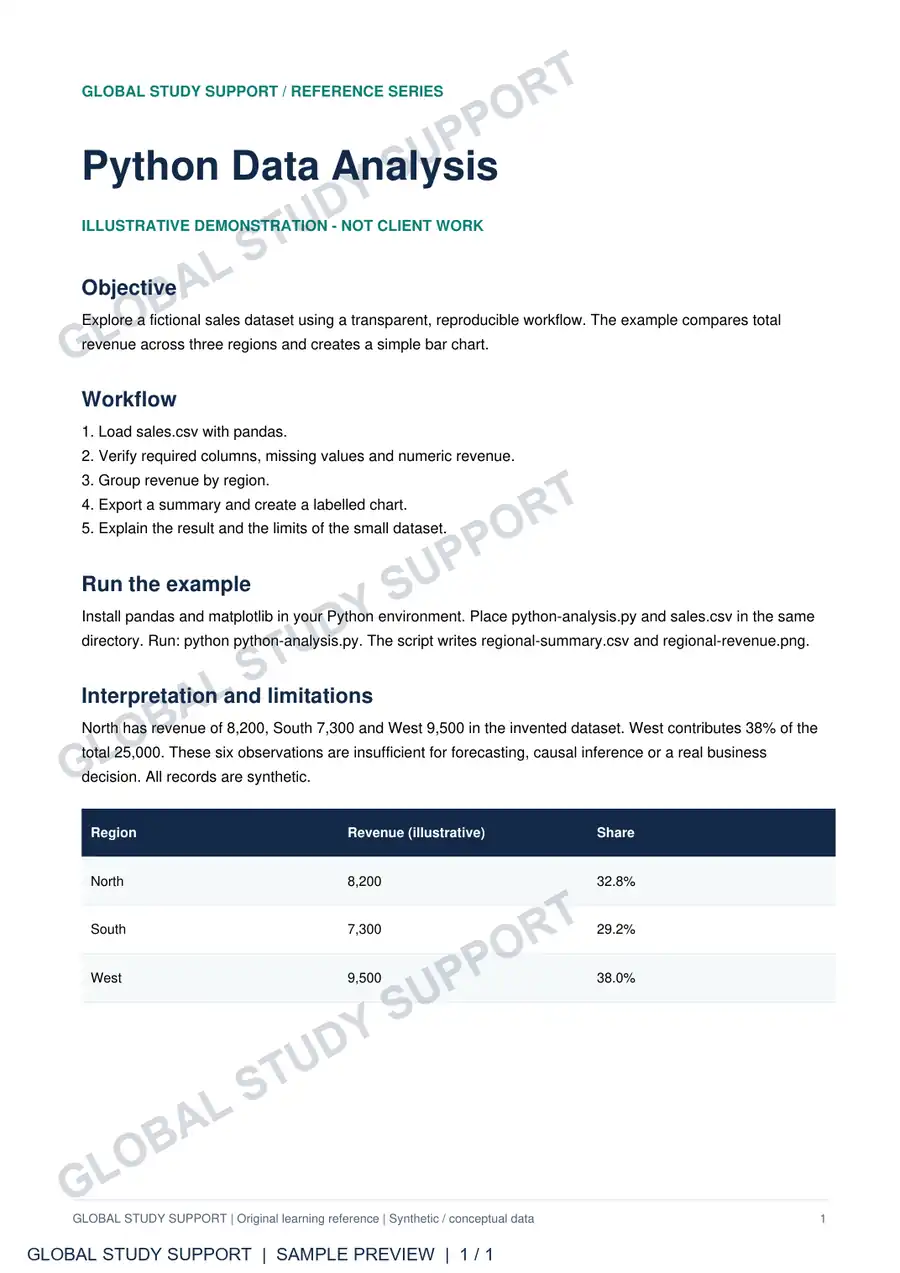
Page 1 of 1. Reference preview.
Reference for viewing and evaluation only. Contact us to discuss guidance for a similar project.
A challenge in mind?
Let’s work through it.
Share your goals. We’ll help you find a clear way forward.