
Statistical Analysis & Hypothesis Testing
Choose methods that fit the study design and variable types, then report assumptions, effect sizes and uncertainty.
Explore this serviceWork from clean data and explicit assumptions to appropriate statistical methods, clear visualisations and careful interpretation.
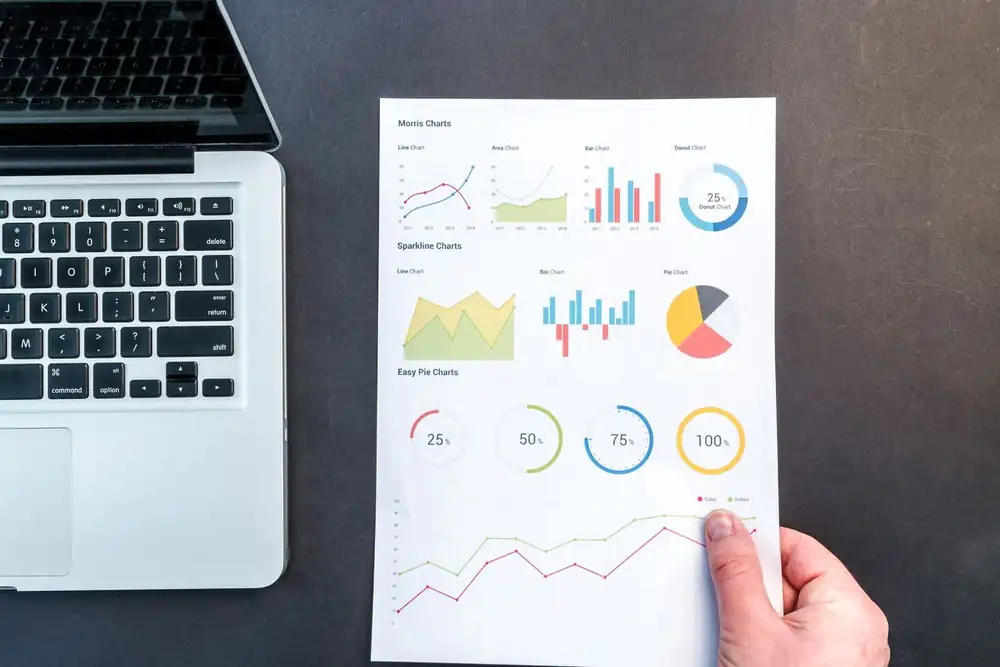
Begin with the research question, variable definitions and study design. We help review data quality, method choice, statistical assumptions and interpretation. Guidance distinguishes a calculated result from a supported conclusion and includes limitations, uncertainty and reproducibility. Participant data should be anonymised before it is shared.
Deliverables depend on the agreed scope. Academic work remains your own; engineering and financial guidance does not replace qualified professional approval.
Choose methods that fit the study design and variable types, then report assumptions, effect sizes and uncertainty.
Explore this servicePrepare survey data consistently and distinguish what a sample supports from claims it cannot establish.
Explore this serviceCreate readable charts and dashboards by matching the visual form to the analytical question and the audience.
Explore this serviceWe review variable types, sample design, dependence, sample size and assumptions, then explain suitable options and their limits.
No. Causal claims depend on design and assumptions. A p-value alone does not establish causal effects or practical importance.
Share your goals. We’ll help you find a clear way forward.